Overview
- Description: Malnutrition and nutritional deficiencies were the primary focus of global nutrition efforts among children and adolescents prior to 2000. Since 2000, according to UNICEF data sources, there has been a steady decline in childhood and adolescent malnutrition and nutritional deficiencies, but a rapid increase in childhood overweight and obesity rates. This can be attributed to changing dietary patterns throughout the world, resulting in this shift. UNICEF reports that obesity rates have increased by 2.5 times across all age groups, along with other figures available on their website, where the dataset was downloaded from Unicef School-aged children and adolescents.
For reference, the UNICEF regions in question along with their abbreviations are: East Asia and the Pacific, Eastern Europe and Central Asia (EECA), East and Southern Africa (ESA), Latin America and the Caribbean, Middle East and North Africa (MENA), North America (NA), South Asia (SA), West and Central Africa (WCA), and Western Europe (WE).
Data Sources
- School-aged children and adolescents dataset — https://data.unicef.org/topic/nutrition/school-children-adolescents/
United Nations Children’s Fund, Division of Data, Analysis, Planning and Monitoring. Analysis of data from NCD Risk Factor Collaboration (NCD-RisC), based on worldwide trends in underweight and obesity from 1990 to 2022: a pooled analysis of 3663 population-representative studies with 222 million children, adolescents and adults. The Lancet 2024. DOI: https://doi.org/10.1016/S0140-6736(23)02750-2
Limitations
Based on the journal Worldwide trends in underweight and obesity from 1990 to 2022: a pooled analysis of 3,663 population-representative studies with 222 million children, adolescents, and adults, available from The Lancet, the study does not explicitly state the sample size for each country and only mentions using representative samples of the general population.
In relation to different BMI categories, a Bayesian hierarchical model was used to estimate trends. For this dashboard, obesity was categorised as having a BMI ≥ 30.
The increase in obesity is prevalent in most parts of the world, with the exception of some Southeast Asian and sub-Saharan African regions and countries.
Methodology and Data
Methodology and data: The ‘Obesity estimates (5–19 years)’ XLSX file was extracted and loaded into Tableau as a Microsoft Excel file. It is important to note that on the UNICEF page, two similar datasets were also available: ‘Overweight estimates (5–19 years)’ and ‘Thinness estimates (5–19 years)’.
To construct the ‘Countries and Regions with the Highest Adolescent Obesity Rates’ bar chart, ‘UNICEF Regions’ and ‘Countries and areas’ were used as the dimensions, with the ‘2022 Both Sexes Point Estimates’ used as the measure. The filters used were ‘UNICEF Regions’ and ‘Countries and areas’, filtering the top ten countries and regions with the highest adolescent obesity rates. ‘Countries and areas’ was used as colour on the Marks card. ‘UNICEF_Reporting_Sub_Region’ was not selected under the ‘UNICEF Regions’ filter, as the focus was on regions rather than reporting sub-regions.
The ‘Summary of Average Obesity Rates for UNICEF Regions’ used ‘UNICEF Regions’ as the dimension, with the average ‘Both Sexes Point Estimate’ selected as text on the Marks card.
‘World Bank Income versus Average UNICEF Regions 2022’ utilised ‘World Bank Income Groups’ and ‘UNICEF Regions’ as dimensions, with ‘2022 Both Sexes Point Estimate’ used as the measure. For filters, ‘World Bank Income Groups’ and ‘UNICEF Regions’ were used, with ‘UNICEF_Reporting_Sub_Region’ excluded. Under the Marks card, ‘UNICEF Regions’ were selected as colour.
Using an external tool, the ‘Obesity estimates (5–19 years)’ XLSX file was pivoted for the purpose of creating a line plot for ‘Average Obesity Rate among UNICEF Regions from 2000–2022’. ‘Year’ was selected as the dimension, with ‘UNICEF prevalence percent’ selected as the measure. The filters used were ‘Year’ and ‘UNICEF Reporting Sub Region’, with null values excluded. Under the Marks card, ‘UNICEF Reporting Sub Region’ was selected as colour.
Results and Visualisation
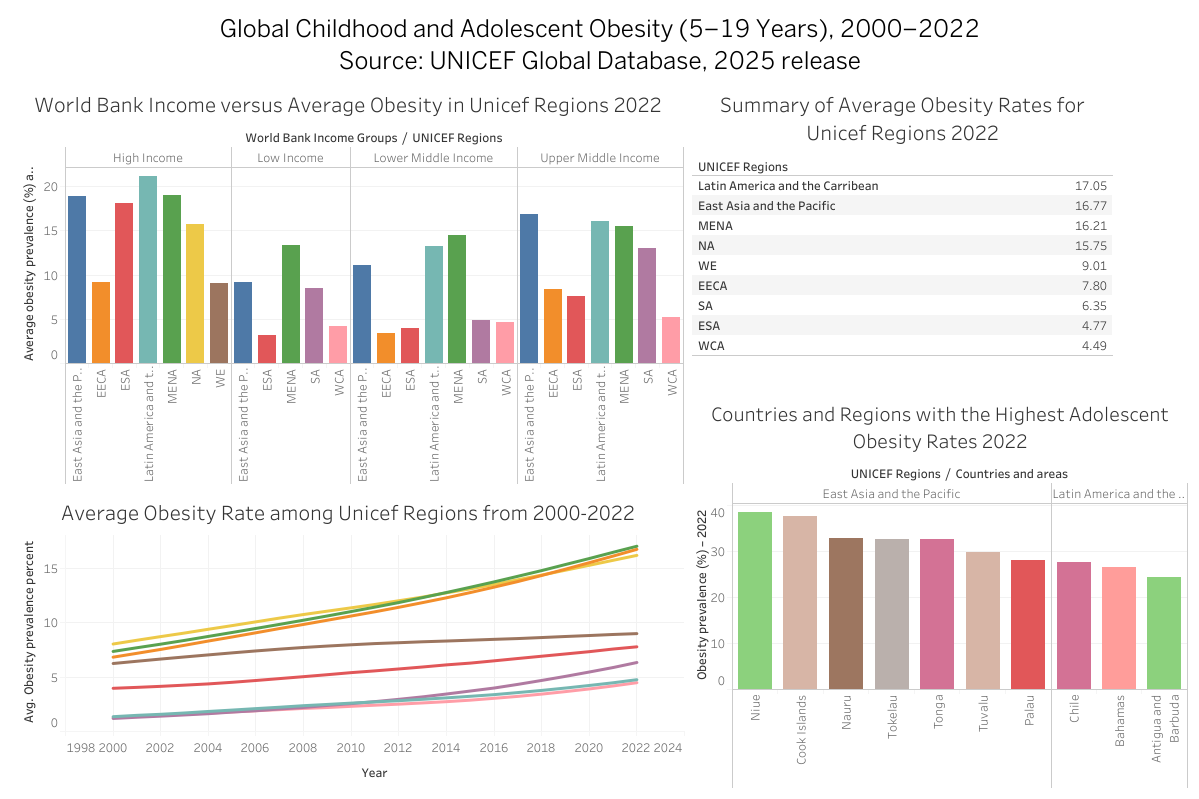
- Results: From the ‘Summary of Average Obesity Rates for UNICEF Regions’, the four regions with the highest obesity rates are: Latin America and the Caribbean, East Asia and the Pacific, Middle East and North Africa, and North America. There is only a 2.66% difference between Western Europe and South Asia. East and Southern Africa and West and Central Africa have similar rates, with only a 0.28% difference in obesity prevalence.
Despite Latin America and the Caribbean having the highest regional average obesity rate, several East Asia and the Pacific countries have higher national rates, as shown in the ‘Countries and Regions with the Highest Adolescent Obesity Rates 2022’ bar chart. Nations such as the Cook Islands, Niue, and Nauru have prevalence rates between 30–40%, compared with Latin American and Caribbean countries, which are generally below 30%. This may reflect population size differences, where smaller nations can show higher prevalence percentages despite having fewer absolute cases.
Analysing the ‘World Bank Income versus Average Obesity in UNICEF Regions 2022’ chart, High Income and Upper Middle Income groups generally show higher obesity prevalence, with some exceptions such as Eastern Europe and Central Asia, Western Europe, East and Southern Africa, and West and Central Africa. For Lower Middle Income and Low Income groups, Latin America and the Caribbean, Middle East and North Africa, and East Asia and the Pacific remain among the most prevalent regions, with South Asia showing lower rates for Low Income groups.
The time series plot ‘Average Obesity Rate among UNICEF Regions from 2000–2022’ confirms these patterns, with Latin America and the Caribbean, East Asia and the Pacific, and Middle East and North Africa showing the highest growth over time compared with other regions.
Global Childhood and Adolescent Obesity Dashboard: