Overview
- Description: The purpose of creating this dashboard was to visualise the frequency of traffic incidents in New Zealand holiday periods between January 1st 2000 and when the dataset was last updated on November 25th 2025. The key holiday periods in question are Christmas–New Year, Easter, Labour Weekend, and the Queen’s Birthday.
The Crash Analysis System (CAS) data is based on traffic crashes reported to the NZTA by the New Zealand Police. CAS covers crashes that occur on roads where the public has legal access by motor vehicle, excluding private roads or jurisdictions.
Data Sources
- Crash Analysis System (CAS) data — https://opendata-nzta.opendata.arcgis.com/datasets/NZTA::crash-analysis-system-cas-data-1/about
Limitations
This dataset is continuously updated in the first week of each month; therefore, the results for 2025 are subject to change, as they had not been updated as of 10th January 2026.
The NZTA has stated that the CAS data is provided on an “as is, where is” basis, removing any liability for actions taken based on this dataset.
The variables in the dataset are formatted for analytical use, which can result in attribute charts that may not appear meaningful and are not suitable for broader analysis or use. The purpose of this project is to visualise these findings rather than use them for direct analysis of the overall dataset, thus complying with the author’s intentions.
Methodology and Data
- Methodology and data: The GeoJSON file was extracted and downloaded from the NZTA website as a spatial file. For reference, other data formats were available, including CSV files.
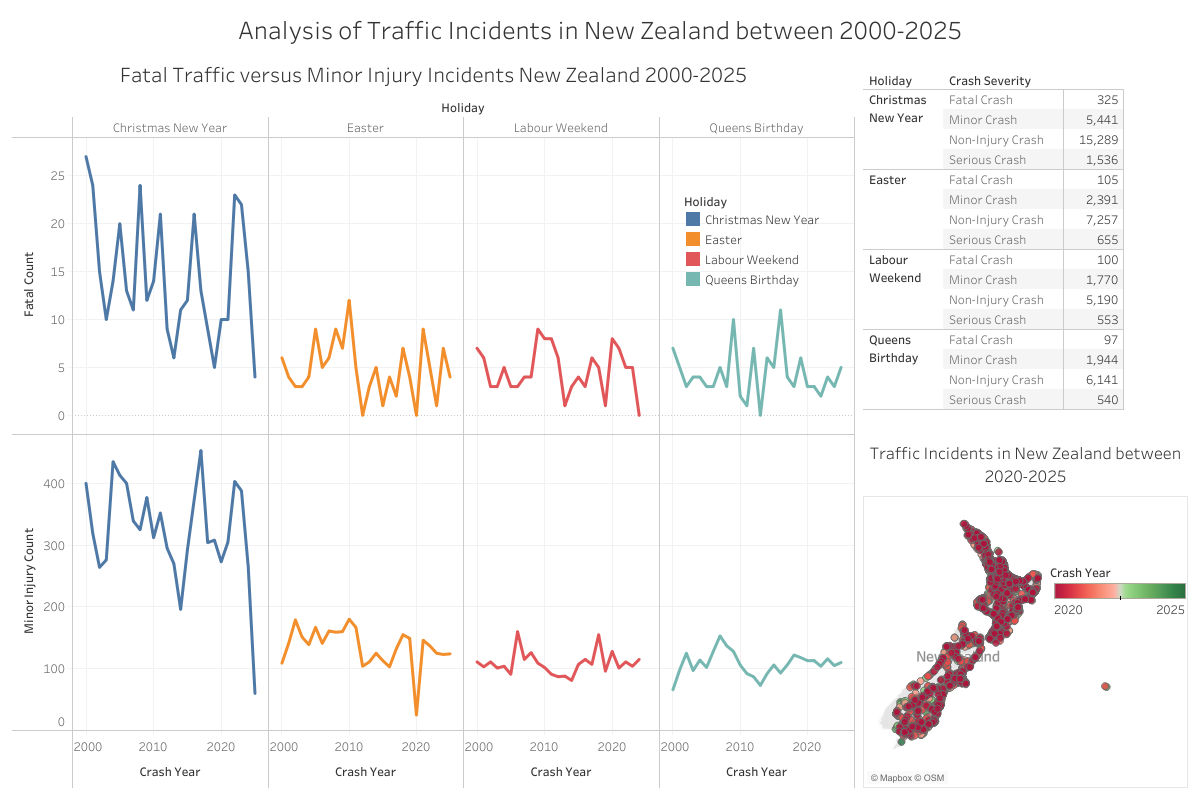
The line plots were generated using ‘Holiday’ and ‘Crash Year’ as dimensions, with ‘Sum Fatal Count’ and ‘Sum Minor Injury Count’ as the measures. ‘Holiday’ was filtered to remove N/A values for periods that were not holidays.
The table summary used ‘Holiday’ and ‘Crash Severity’ as dimensions, excluding periods that were not holidays. Filters used included ‘Crash Severity’ and ‘Holiday’. The Crash Analysis System data was used as the text on the Marks card.
The Map Plot was generated using ‘Geometry’ autogenerating the ‘Latitude’ and ‘Longitude’ coordinates on the map. ‘Holiday’ and ‘Crash Year’ were used as filters, with ‘Crash Year’ being specifically filtered for years from 2020-2025. ‘crashLocation1’ and ‘crashLocation2’ were used as labels on the Marks card, along with ‘Crash Year’ being selected as Colour and ‘Geometry’ automatically being assigned as Detail.
Results and Visualisation
- Results: From the line plots, the number of fatal and minor injury traffic incidents during the Christmas–New Year period has decreased following a spike in 2022. This suggests that, due to confounding variables and reasons that cannot be discussed as per the author’s request, the strategies and implementations of the NZTA, New Zealand Police, and other stakeholders may be contributing to a reduction in road incidents during this period.
Analysis of the line plots shows that minor injury traffic incidents are less volatile compared with fatal traffic incidents.
The Christmas–New Year period has the highest number of fatal and minor injury traffic incidents, which is expected as it is the longest holiday period in New Zealand. Easter ranks second for the highest number of traffic incidents, as it is the second-longest holiday period. The Queen’s Birthday and Labour Weekend have higher proportions of non-injury crash incidents. As the Queen’s Birthday and Labour Weekend are similar in length and are typically one-day holiday periods, this outcome is expected.
Analysing the Map Plot, it is evident that there were more traffic incidents from the early 2020’s in comparison to periods closer to 2025. This is especially true for the Auckland and Northland regions. In comparison, regions in the South Island have fewer traffic incidents and are easily identifiable and less clustered.
Traffic Incidents Dashboard: