Overview
- Description: The 1912 Titanic shipwreck, popularised in fiction with James Cameron’s 1997 film, resulted in a death toll of 1502 out of 2224 total passengers. The dataset based on this disaster, available via the following links Titanic Kaggle and Data Science Dojo Github, includes 12 variables and 891 rows representing a subset of the Titanic population.
The purpose of this project is to conduct Exploratory Data Analysis (EDA) and visualise passenger demographics, both survivors and victims, using the following Python libraries: Matplotlib, Seaborn, NumPy, and Pandas.
Data
Variables within this dataset are: Name, Ticket Number, Passenger ID, Survival (0=No, 1=Yes), Ticket Class (1 = 1st, 2 = 2nd, 3 = 3rd), Sex, Age, Number of Siblings/Spouses Aboard, Parents or Children Aboard, Passenger Fare, Cabin Number and Embarked Location (C = Cherbourg, Q = Queenstown, S = Southampton).
Using the descriptions available on Kaggle, Age was estimated and fractional if less than 1 year old.
In relation to Number of Siblings/Spouses Aboard, only husbands and wives were considered, ignoring other relationships such as fiancés.
The variable Parents or Children Aboard contained some zero values, as some children only travelled with a nanny.
Limitations
The dataset contained missing and NaN values, especially in the Age, Cabin and Embarked columns. Thus, some of the results may be inconclusive as the complete dataset was unavailable.
Methodology and Results
- Methods Overview: To conduct EDA and visualise passenger demographics, a combination of different visualisation techniques was employed, including histograms, pie charts, stacked and regular bar charts, and violin plots. For the full code and visualisations, these can be accessed via the GitHub account Nathaniel Pyle
Methods and Results: The data was loaded into Python as a Pandas dataframe, where the index_col = 0. The original shape of the dataframe consisted of 891 rows with 12 columns.
Using the dtypes function in Pandas, the columns were shown to be a combination of floats, integers, and strings/objects.
Using the check_nan function in Pandas, it was discovered that approximately 80% of all rows had missing or NaN values. If these rows were removed, the dataframe would reduce from 891 rows to 183, significantly reducing the dataset by 79.46%. This would be counterproductive for EDA on the various demographics of Titanic survivors; therefore, an alternative approach was taken.
Through trial and error using different thresholds with the dropna function to determine how many columns contained real values, 11 was found to be the optimal number. This meant that 733 out of 891 rows (82.27%) contained 11 real values. This reduced the dataframe to 733 rows.
Previous attempts using thresholds of 2, 3, 9, and 10 did not decrease the number of rows.
This resulted in a decrease in NaN values in the following columns: Age from 177 to 19, Cabin from 687 to 529, and Embarked showed no change. Overall, NaN values were reduced from 866 to 550, a percentage decrease of 36.49%. Some NaN values were kept in certain rows, as they did not significantly affect the visualisation process.
The following columns were dropped as they did not provide any additional insight into Titanic survival demographics: Passenger ID, Ticket Number, Name, and Cabin. No additional metadata suggested that these variables influenced survival.
Survival was paired with the seven variables in the modified Titanic dataframe:
Ticket Class (1 = 1st, 2 = 2nd, 3 = 3rd), Sex, Age, Number of Siblings/Spouses Aboard, Parents or Children Aboard, Passenger Fare, and Embarked Location (C = Cherbourg, Q = Queenstown, S = Southampton).
To accomplish this, the Pandas groupby function was used to create various pandas.core.series one-dimensional arrays. Many of these series were unstacked so their structures could be reshaped and converted into dataframes for easier plotting.
Visualisations
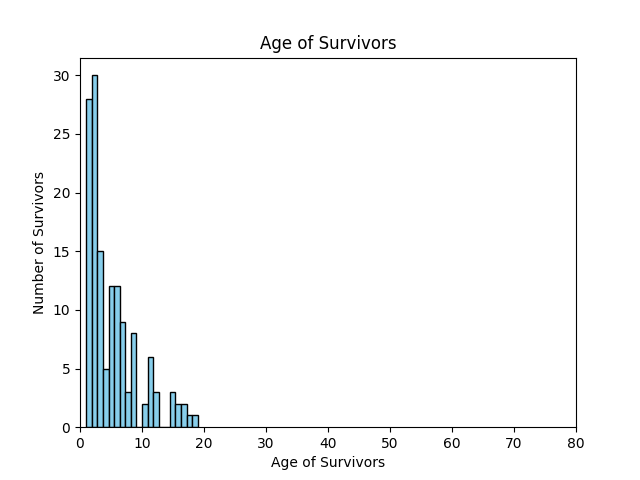
Histogram Age Demographics:
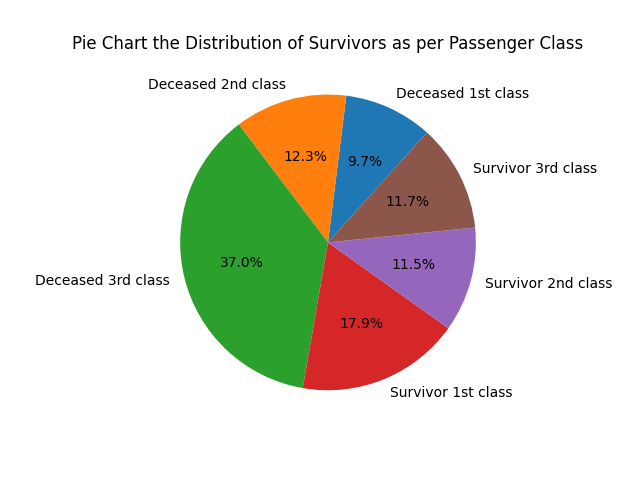
Pie chart Passenger Class:
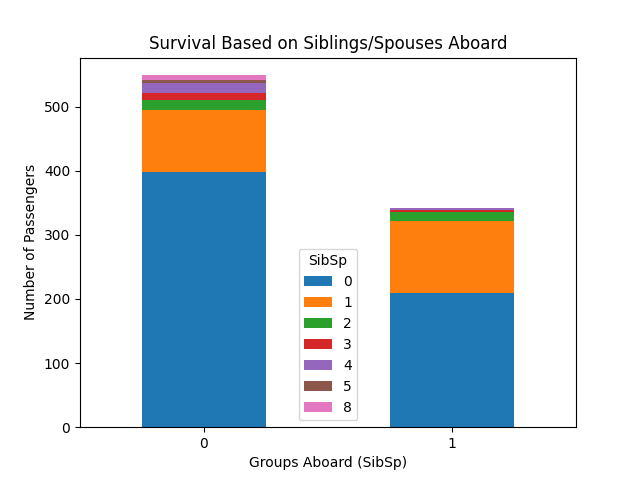
Stacked Bar chart based on Siblings/Spouses Aboard:
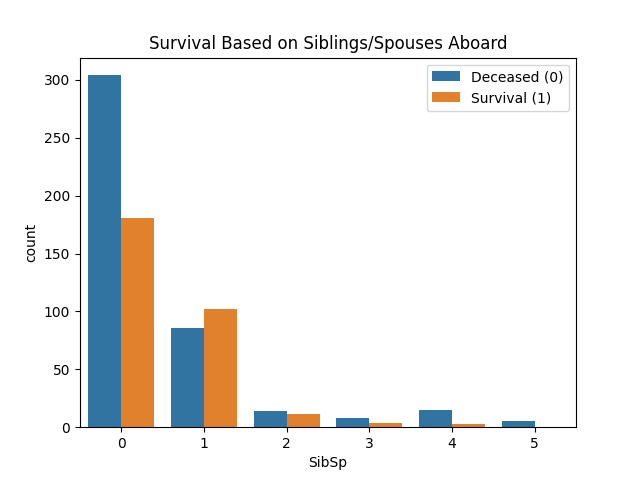
Bar chart based on Siblings/Spouses Aboard:
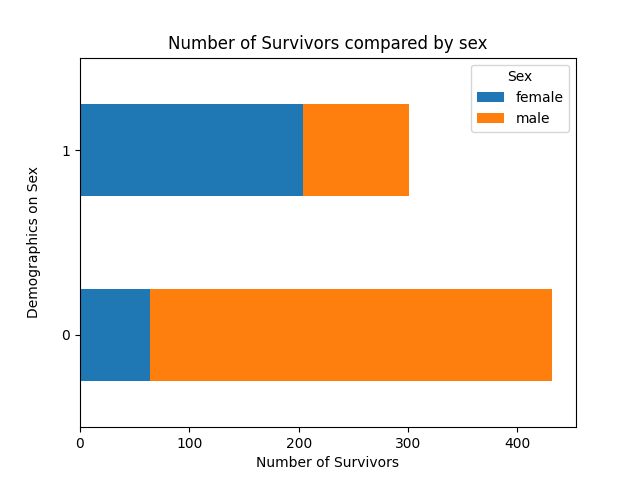
Number of Survivors compared by Sex:
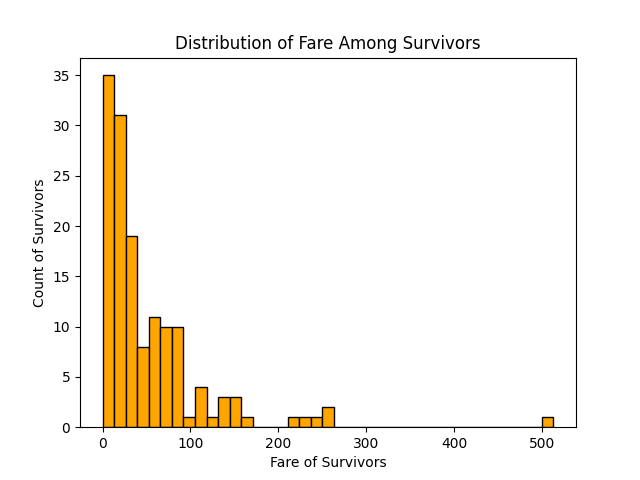
Fare Distribution Among Survivors:
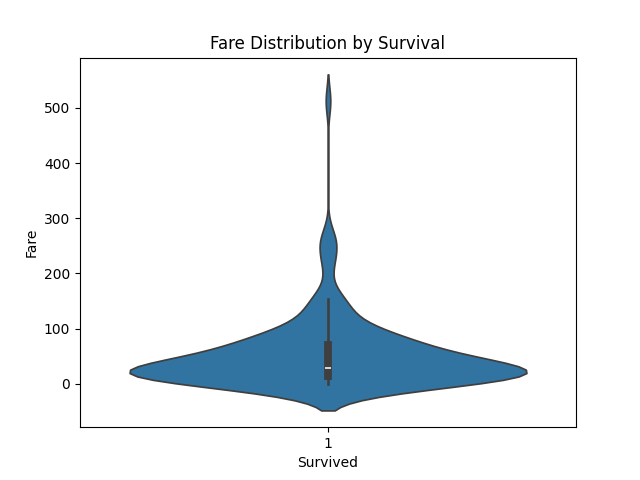
Violin Plot Fare Distribution Among Survivors:
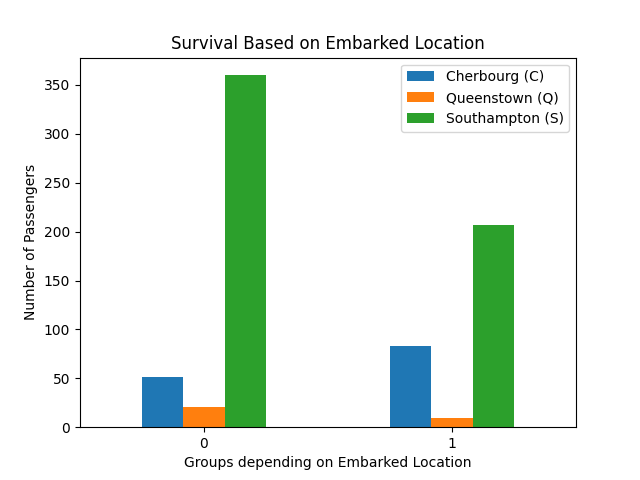
Bar Chart Survival Based on Embarked Location:
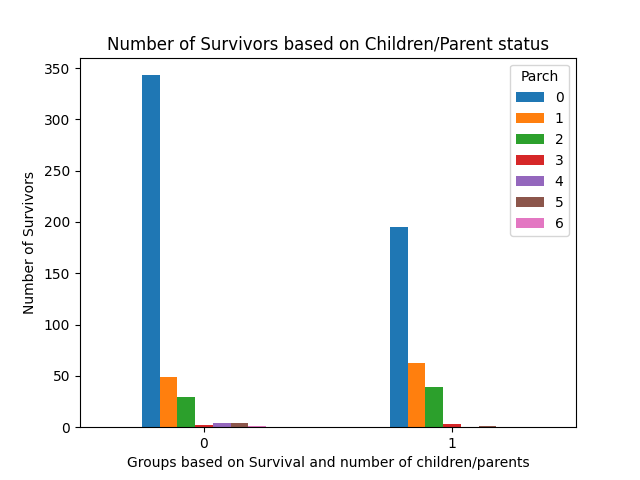
Bar Chart Survival Based on Children and Parent Status:
Discussion
From the visualisations, the most influential factors in Titanic survival rates appear to be:
- Age — younger passengers, especially those under ten years old, had higher survival rates.
- Passenger Class — 37% of deceased passengers were in third class, compared to 12.3% in second class and 9.7% in first class; higher-class passengers survived more often.
- Sex — most of the deceased were male, indicating a significant survival advantage for females.
- Passenger Fare — passengers who paid higher fares generally had a greater likelihood of survival.
Further research could be conducted on:
- Survival Based on Siblings/Spouses Aboard — most groups showed little differentiation, except passengers travelling alone.
- Embarked Location — Southampton had significantly fewer survivors than other embarkation points; further investigation may explain this disparity.
- Parents or Children Aboard — patterns were mostly consistent, though passengers travelling alone (no parents or children aboard) tended to have lower survival rates.
Further Links
For more information about the Pandas and Matplotlib packages, please access the following URLs.