Overview
- Description: The purpose of this project was to explore the Breast Cancer Wisconsin (Diagnostic) dataset, available from the UC Irvine Machine Learning Repository. Through the use of Exploratory Data Analysis (EDA) and machine learning models, this project aimed to gain a basic understanding of which variables were most important in determining whether cancer was malignant or benign.
Data Sources
The Breast Cancer Wisconsin (Diagnostic) dataset was limited, containing only 569 cases and 30 variables.
The EDA and machine learning models used in this project included correlation matrices, Linear Discriminant Analysis (LDA), Quadratic Discriminant Analysis (QDA), and Principal Component Analysis (PCA).
LDA and QDA, two binary classification models used in machine learning, were used specifically to identify key variables. In addition, PCA was used to gain a more in-depth understanding of the importance of certain variables.
Methodology
- Technologies: Various packages were used throughout this project, including
corrplot,readODS,dplyr,tidyverse,MASS, andggplot2.
Data Preprocessing
The ‘ID’ variable was removed as it did not provide additional benefit to the analysis. The diagnosis column was converted into a binary variable and renamed ‘cancer’, where malignant cases were classified as 1 and benign cases as 0. The original ‘Diagnosis’ column was then removed from the data frames.
‘Cancer’ was used as the dependent variable for the EDA and machine learning processes and was compared against the remaining variables.
Correlation Matrix Methods
Correlation matrices were created to identify which variables exhibited the strongest correlations with one another.
LDA and QDA Methods
To perform LDA, the variables were scaled to have a mean of 0 and a standard deviation of 1. The means and standard deviations of the scaled variables were then computed.
For both LDA and QDA, the data was split into 70% for training and 30% for testing. The model was trained using the 70% partition, with ‘cancer’ as the response variable, and was then tested on the 30% partition. Accuracy was calculated by comparing predicted class labels with actual class labels.
QDA followed similar procedures, with the exception that the variables were not scaled and their means and standard deviations were not computed. The QDA model also used a 70% training partition and a 30% testing partition.
Principal Component Analysis Methods
PCA involved scaling the variables in the same manner as LDA. The resulting scores and loadings were multiplied by -1 to adjust the direction of the principal components. The data was analysed in descending order of explained variance.
The proportion of variance explained by each principal component was calculated by squaring the standard deviations of the components. These proportions were stored in the variable ‘var_explained’.
Results
- Key Findings: The correlation matrices revealed significant overlap between variables, resulting in multicollinearity. As a result, LDA, QDA, and PCA provided greater insight and improved interpretability.
Correlation Matrix Results
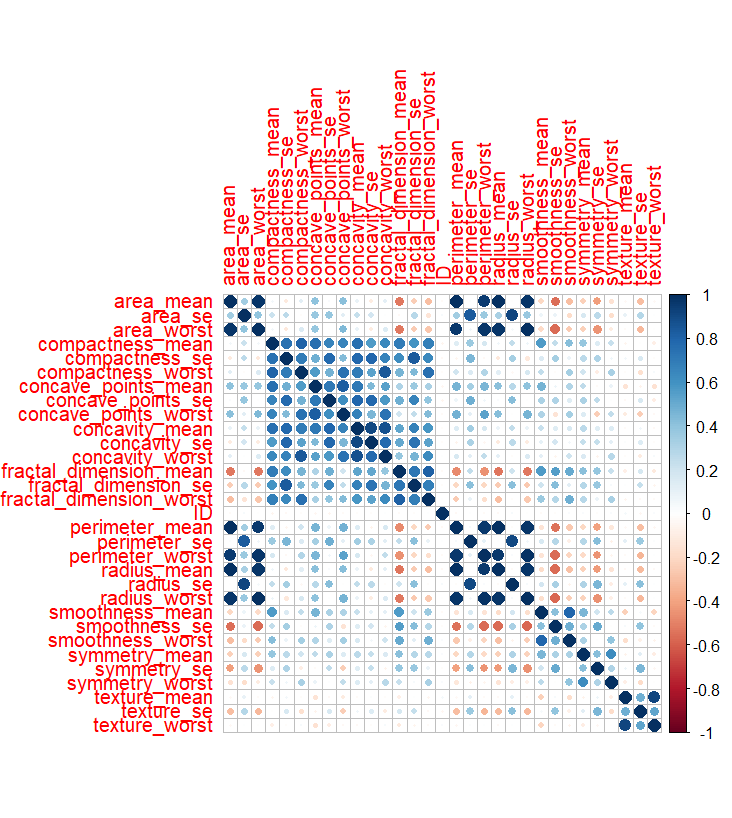
When analysing the correlation matrices, variables plotted against themselves along the diagonal resulted in a correlation of 1.0. In the benign correlation matrix, several variables exhibited strong correlations, including ‘compactness’, ‘concave points’, ‘concavity’, and ‘fractal dimension’.
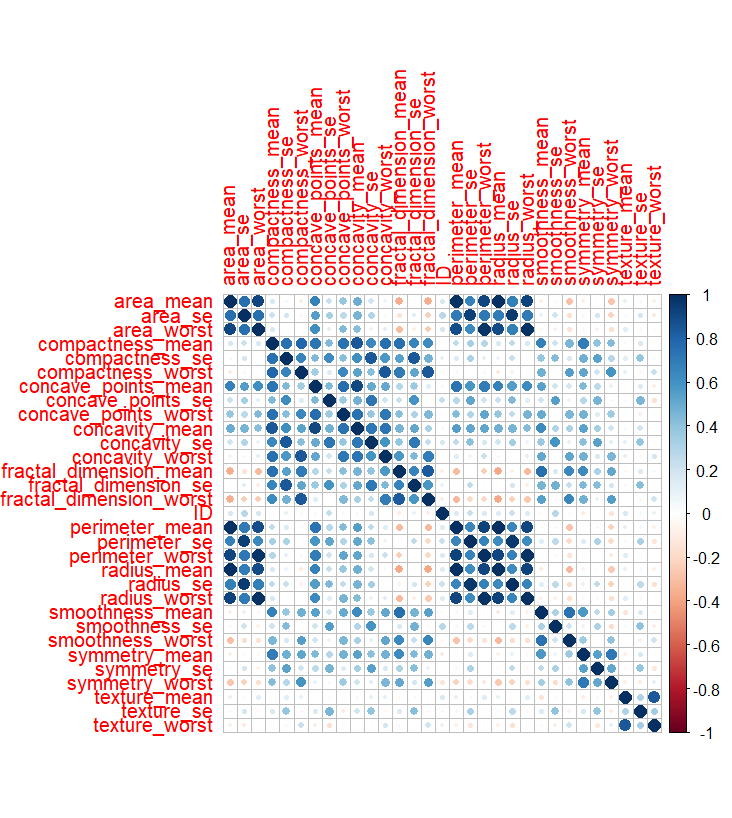
Variables related to similar measurements, such as area and perimeter, also showed strong correlations. The malignant correlation matrix followed a similar pattern, with even stronger relationships observed between variables.
LDA and QDA Results
Comparing the results of LDA and QDA, both models demonstrated similar training accuracy. LDA achieved an accuracy of 94.5%, while QDA achieved an accuracy of 95.3%. The overall difference in accuracy of 0.8% was minimal.
Both models showed similar prior probabilities for detecting malignant and benign cases, with approximately 65% classified as benign and 35% as malignant.
In the LDA model, the mean ‘radius_mean’ value for malignant cases was -0.5568, while for benign cases it was 0.9787, indicating that ‘radius_mean’ was higher for malignant cases.
In terms of coefficients, ‘radius_worst’ had the largest positive coefficient at 5.7927, strongly influencing classification outcomes. To a lesser extent, ‘perimeter_mean’ also influenced classification, with a coefficient of 3.7534.
For QDA, the group mean of ‘radius_mean’ was 12.1141 for benign cases and 17.12036 for malignant cases, again indicating higher values for malignant cases.
Other group means, such as ’texture_mean’, were slightly higher for malignant cases (21.60877) compared with benign cases (17.92915). Variables including ‘perimeter_mean’, ‘area_mean’, and ‘area_se’ showed particularly large differences between groups.
Overall, QDA performed slightly better than LDA, suggesting that the data was not perfectly linear. However, the difference in performance was minimal, and further optimisation could improve both models.
PCA Results
PCA was used to analyse correlations within the dataset. Unlike correlation matrices, PCA is not susceptible to multicollinearity and is capable of capturing the greatest variation in the data.
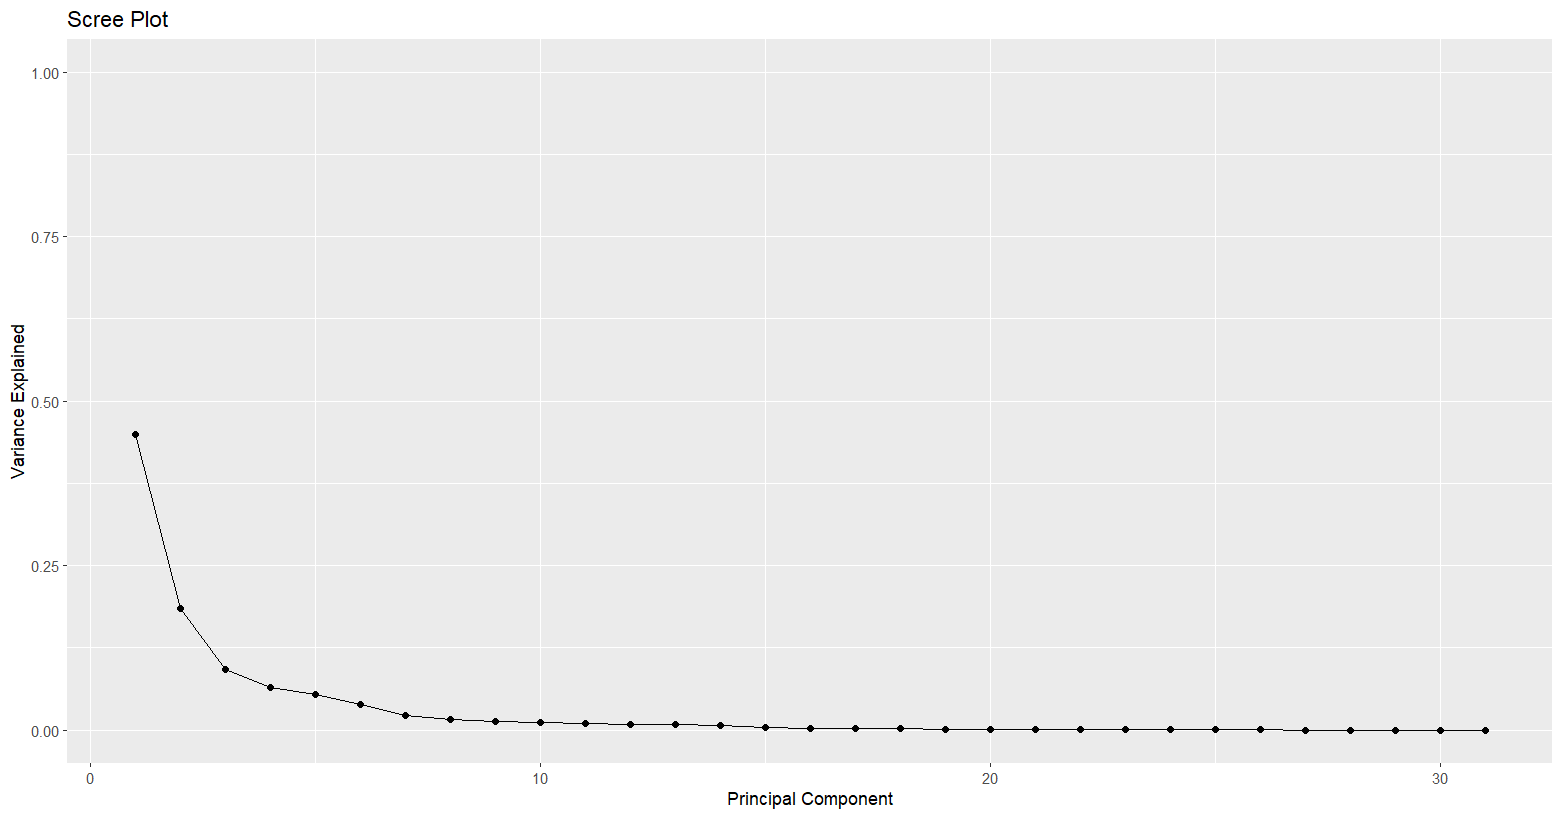
Inspection of the results showed that the first principal component (PC1) accounted for the greatest variation, with the strongest loadings observed for ‘radius_mean’, ‘perimeter_mean’, and ‘area_mean’, with values of 0.2163, 0.2245, and 0.2179 respectively.
The second principal component (PC2) explained variation not captured by PC1, including ‘smoothness_mean’ and ‘compactness_mean’, with values of 0.1887 and 0.1547. These findings were visualised using a scree plot.
Visualisations
Correlation Matrix Benign
Correlation Matrix Malignant
Scree Plot
Conclusion
- Takeaways: The correlation matrices showed that size-based variables exhibited the strongest correlations, despite the presence of multicollinearity when variables were compared against themselves.
LDA and QDA were used to analyse coefficients and group means for binary classification. QDA slightly outperformed LDA, indicating that the data was not perfectly linear.
PCA revealed that most variation was explained by the first two principal components, with decreasing variation explained by subsequent components. Overlap between benign and malignant cases was observed in the visualisations.
References
Some of the sources used for reference included An Introduction to Statistical Learning with Applications in R. The code used in this project is available in the following GitHub repository: Nathaniel Pyle.
Citation
The following citation and acknowledgements are made to the original creators of this dataset.
Dr. William H. Wolberg, General Surgery Dept., University of Wisconsin, Clinical Sciences Center, Madison, WI 53792
wolberg@eagle.surgery.wisc.edu
W. Nick Street, Computer Sciences Dept., University of Wisconsin, 1210 West Dayton St., Madison, WI 53706
street@cs.wisc.edu, 608-262-6619
Olvi L. Mangasarian, Computer Sciences Dept., University of Wisconsin, 1210 West Dayton St., Madison, WI 53706
olvi@cs.wisc.edu